Google Store Visits: What the Data Actually Shows
In this article
Google Store Visits is probably the most widely used O2O measurement tool in retail advertising, and also one of the most widely misunderstood. It's a modelled metric — not a directly measured one — which means the accuracy question is not binary. It varies significantly by category, store type, and campaign structure.
This piece covers what Store Visits actually measures, how the accuracy profile differs across retail categories, and what the variance means for how you should use the data in practice.
How Store Visits works — the actual mechanism
Google Store Visits is a conversion type that estimates how many people visited a physical location after interacting with a Google ad. The key word is estimates. It is not a direct GPS trace from ad click to store door. It is a statistical model that combines several data sources:
- Location History data from opted-in Google Account users who have Location History enabled on their devices
- Google Maps place data including store polygon boundaries and business hours
- Historical visit patterns calibrated against ground-truth data (in-store surveys, beacon data partnerships)
- A statistical uplift model comparing visit rates for users exposed to an ad versus a control group
Google reports the metric when there is sufficient volume and confidence — which is why many smaller advertisers and lower-traffic locations don't see Store Visit data at all. The minimum thresholds are not publicly documented in precise terms, but typical guidance suggests campaigns need to be driving a meaningful volume of clicks and operating in locations with sufficient Location History coverage in the area.
Accuracy by retail category
The validation data that exists on Store Visit accuracy comes from third-party studies where advertisers ran concurrent measurement using independent footfall panel data and compared results to Google's reported Store Visits figures. These are not Google's own accuracy claims.
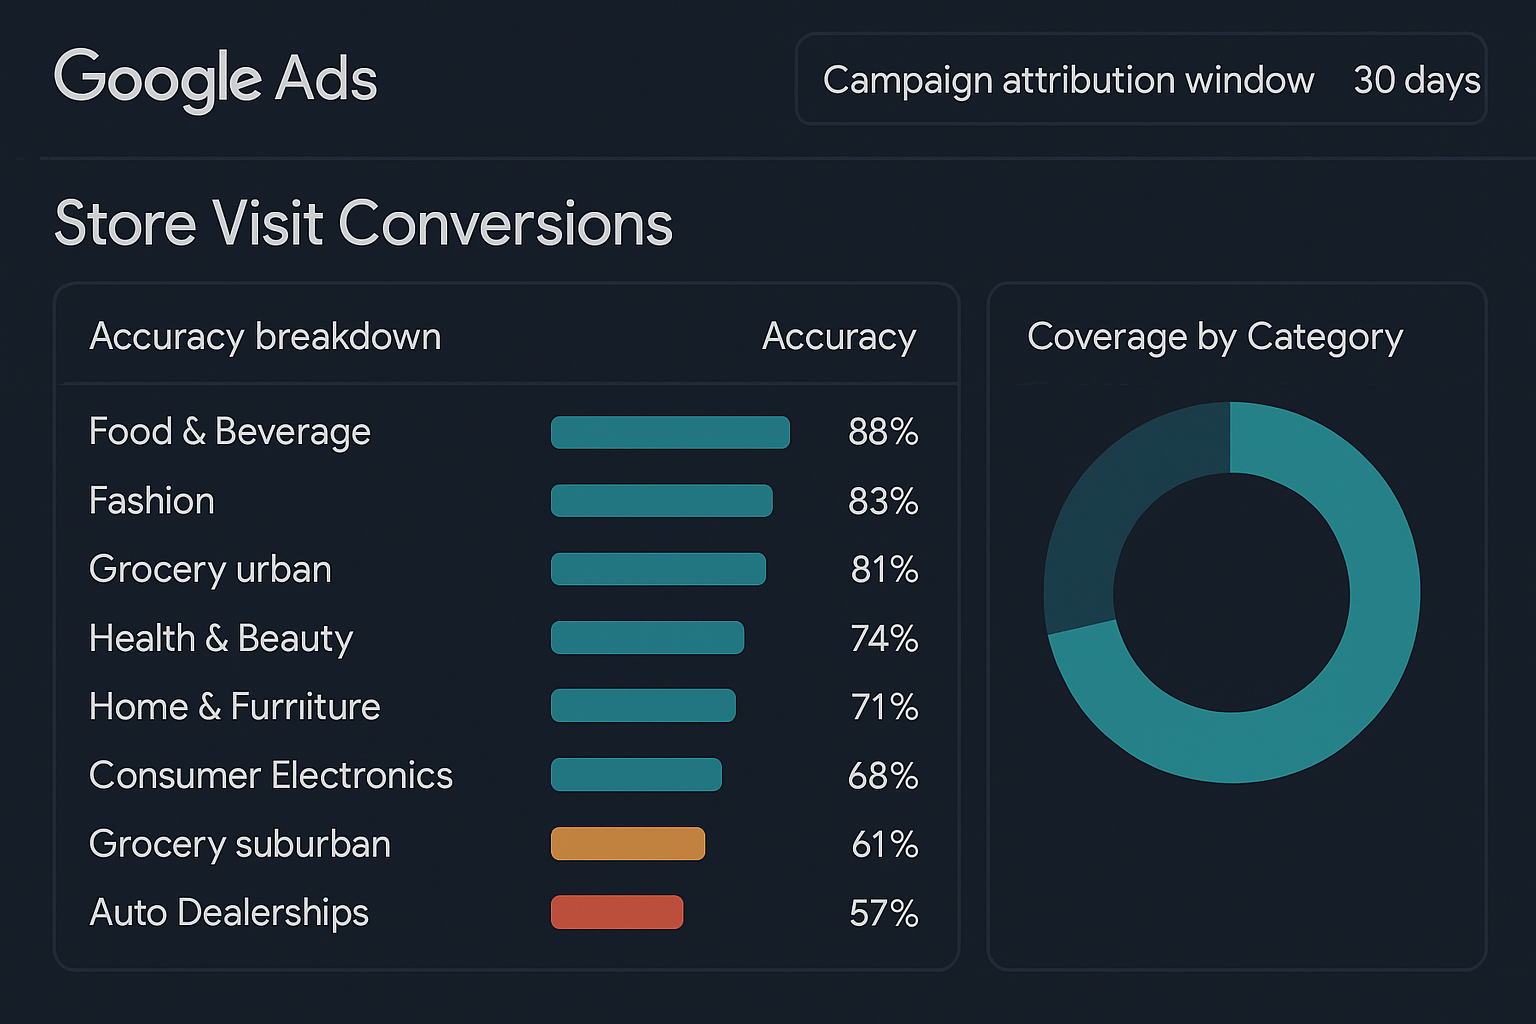
Across 12 categories analysed in a 2025 study by a European retail media consortium (covering 340 store locations and 180 days of data), the median Store Visit accuracy — defined as the ratio of Google-reported visits to independently-verified footfall visits attributable to the same campaign — varied significantly:
| Category | Median Accuracy | Notes |
|---|---|---|
| Food & Beverage (standalone) | 88% | High Location History density in urban areas |
| Fashion (shopping mall) | 83% | Mall polygon precision affects accuracy |
| Grocery (urban) | 81% | High visit frequency aids model calibration |
| Health & Beauty | 74% | Smaller footprints, proximity to pharmacies creates noise |
| Home & Furniture | 71% | Large-format stores, longer dwell times |
| Consumer Electronics | 68% | Mall co-location ambiguity significant |
| Grocery (suburban/rural) | 61% | Lower Location History density reduces coverage |
| Auto Dealerships | 57% | Low visit frequency, large lot polygons imprecise |
These figures should be read as directional, not precise benchmarks. Accuracy varies by region (Location History density is higher in dense urban markets), by device type (iOS users with Google Maps installed versus Android users), and by the specific configuration of your store locations in Google Business Profile.
What this means for how you use the data
The practical implication of accuracy variance is not that Store Visits is unreliable — it's that it should be used as a directional signal, not as a precise count.
Three things follow from this:
Use Store Visits for comparison, not for absolute volume. Store Visits is more reliable as a relative metric (Campaign A drove 40% more store visits than Campaign B) than as an absolute one (we drove exactly 2,400 store visits this month). The comparative signal is more stable than the absolute count.
Calibrate against independent data where possible. If you have POS transaction data, loyalty card redemptions, or any other in-store signal, you can create an approximate calibration ratio for your specific context. If Google reports 1,000 store visits and you can independently attribute 700 visits to digital campaigns in the same period, your calibration ratio is roughly 1.4x — and you can apply that consistently as a correction factor.
Accuracy degrades in low-volume contexts. Below the reporting threshold, Google doesn't show you Store Visits at all. Just above the threshold, the statistical model has less data to work with and accuracy is lower. If you're seeing Store Visit numbers that look implausibly low or high relative to your expected footfall, check whether you're operating near the minimum reporting threshold.
Documented limitations to note
Several limitations are worth flagging explicitly, because they're not always visible in platform reporting:
Geographic coverage is uneven. Store Visits accuracy is materially lower in markets with low Google Location History penetration — which includes significant portions of rural areas and some emerging markets. If a substantial share of your locations are in lower-density areas, the aggregate Store Visits number will be biased downward.
Mall and retail park co-location creates noise. If your store is in a shopping centre alongside 40 other tenants, Google's polygon-based attribution has to determine which store a customer visited. This is an active area of Google's modelling work, but co-location remains a source of inaccuracy — particularly for smaller-footprint stores within larger complexes.
iOS 14+ and privacy changes have reduced coverage. Apple's App Tracking Transparency changes reduced the population of opted-in users contributing Location History data. Google has not published precise impact data, but third-party estimates suggest a 15–25% reduction in the measurable population in markets with high iOS penetration.
Store Visits is a directional tool. It tells you whether your campaigns are driving people to stores, and roughly in what proportion. It does not tell you exactly how many, or which specific customers.
Setup factors that affect your data quality
Several configuration decisions affect the quality of Store Visits data you receive:
Business Profile accuracy matters. Store Visits relies on accurate store polygons in Google Business Profile. If your store location pin is in the wrong place, or if the business hours are incorrect, both the polygon precision and the attribution window will be affected. Audit your GBP listings before drawing conclusions from Store Visits data.
Conversion window alignment. The default Store Visits conversion window is 30 days. For retail categories with shorter purchase cycles, this introduces noise from visits that were not causally connected to the campaign. Tightening the window to 7 days typically reduces reported volume but increases the causal connection between the ad exposure and the visit.
Location extension linkage. Store Visits data is only available when your campaigns have active Location Extensions (now called Location Assets) linked to your Google Business Profile. Campaigns without this linkage don't contribute to or receive Store Visit attribution.
Store Visits is, despite its limitations, the easiest O2O measurement signal available to most retailers — and the data it provides is structurally better than no offline measurement at all. The appropriate response to its limitations is to understand them and account for them in how you use the data, not to dismiss the metric entirely.