Your ads are working.
Your stores aren't seeing it.
Analytical tools, benchmarks, and frameworks that connect online campaign data with offline business outcomes — built for retail marketing managers who need to close the measurement gap.
Bridge
of local purchases begin with an online search
higher LTV for customers acquired through O2O channels
in retail sales influenced by digital in 2024
of marketers cannot measure cross-channel attribution
Where the data gaps live
Four analytical domains that determine whether your digital spend translates into measurable real-world growth.
Omnichannel Strategy
Frameworks for connecting paid digital campaigns to offline conversion events. Includes attribution modeling, channel sequencing and measurement planning.
Retail & Local Commerce
Store visit tracking, local SEO, Google Business Profile optimization, and geofencing strategies specific to physical retail operations.
Growth Analytics
Measurement frameworks for multi-touch attribution, incrementality testing, and building dashboards that connect digital spend to in-store revenue.
Customer Experience
Journey mapping methodologies that trace customer paths from digital touchpoints through in-store interactions to repeat purchase behavior.
Technology Stack
Evaluations and comparisons of CDP platforms, store analytics tools, POS integrations, and ad tech that bridges online signals with offline data.
Interactive Tools
Calculators, audit templates, and generators built for practitioners — not consultants. Get a working answer in under five minutes.
Research & Analysis
Data-led pieces on omnichannel measurement, retail technology, and customer acquisition.
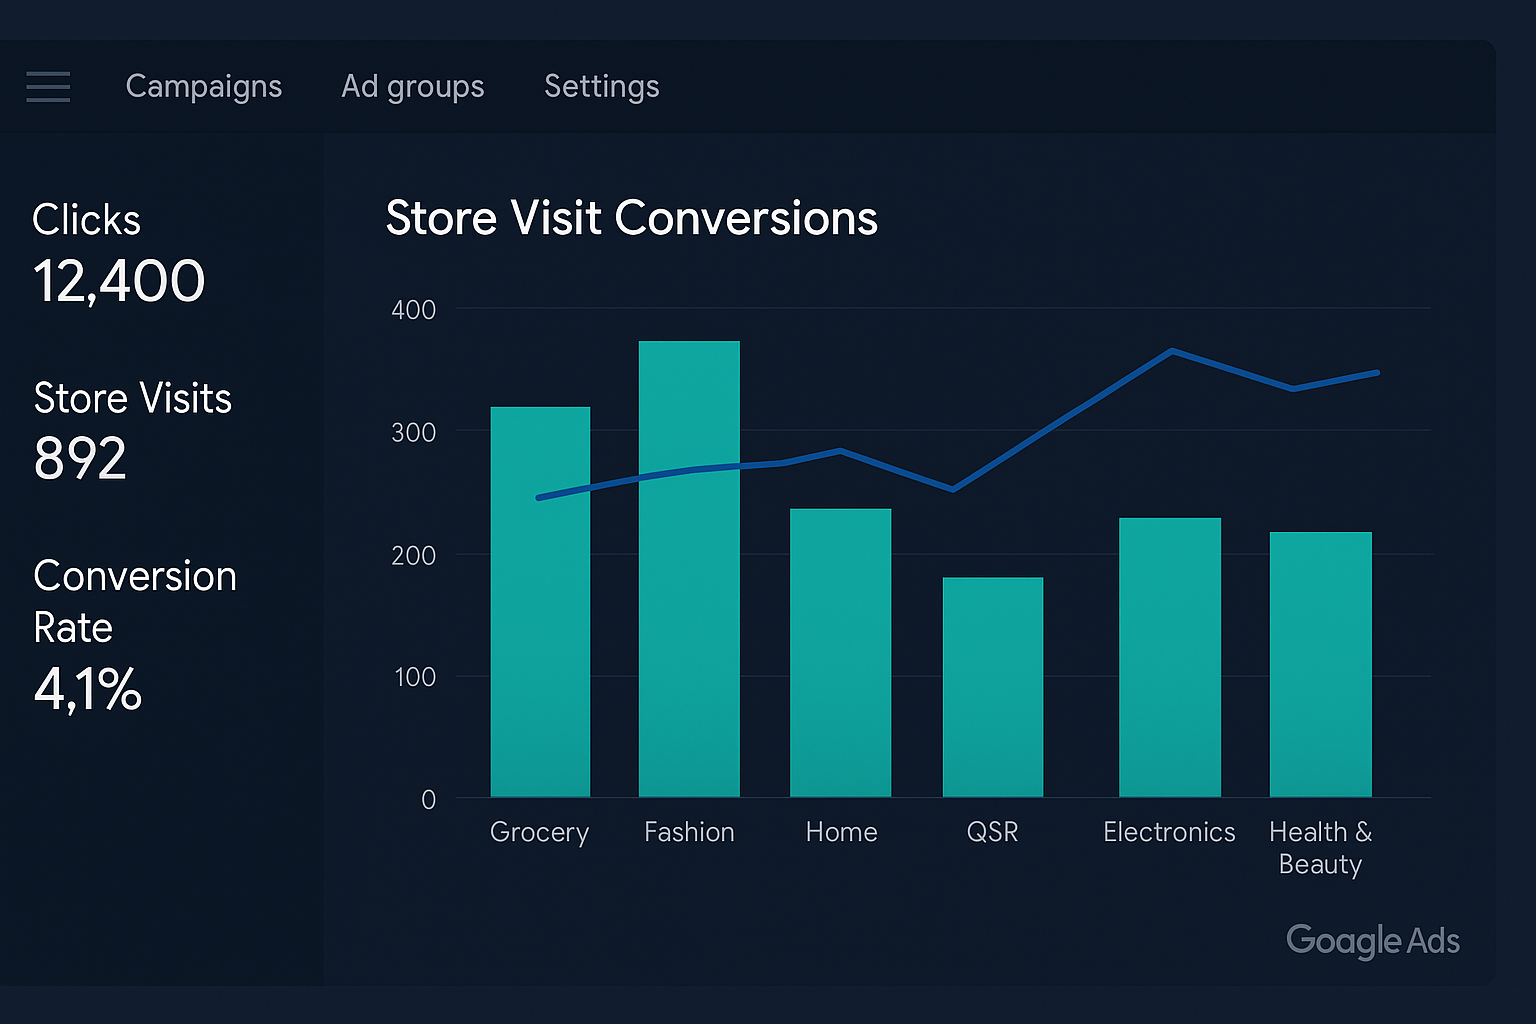
A methodological breakdown of how Google models store visit attribution and what reliability to expect from different campaign types.
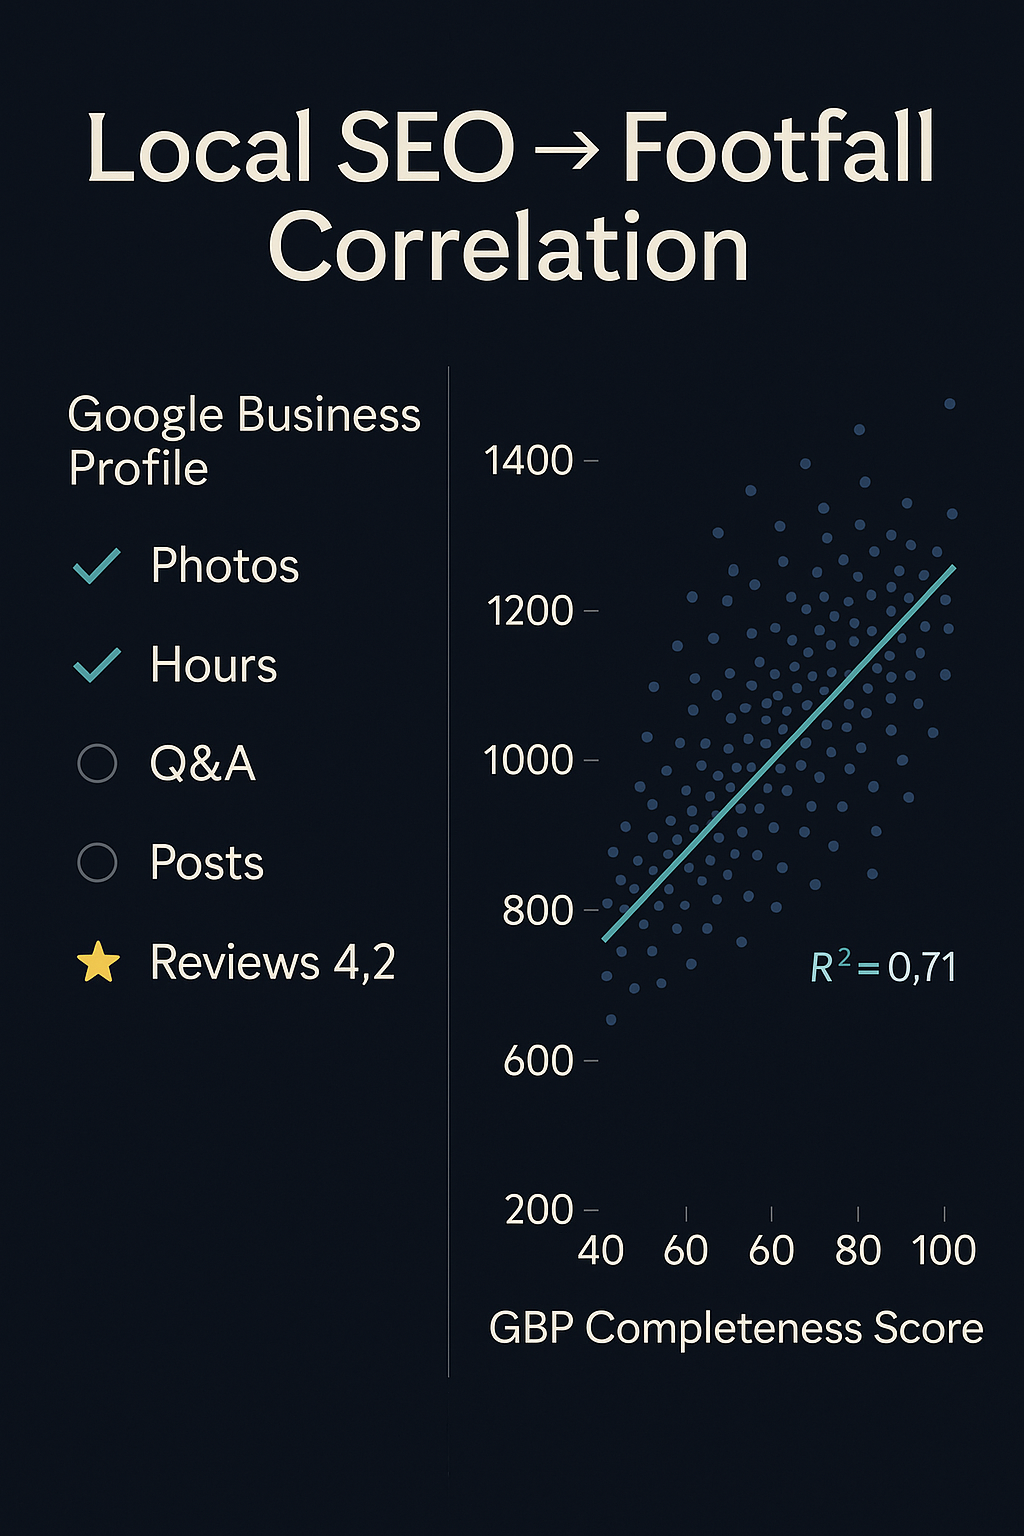
Analysis of 340 retail locations linking Google Business Profile completeness scores with weekly in-store visit data over 12 months.
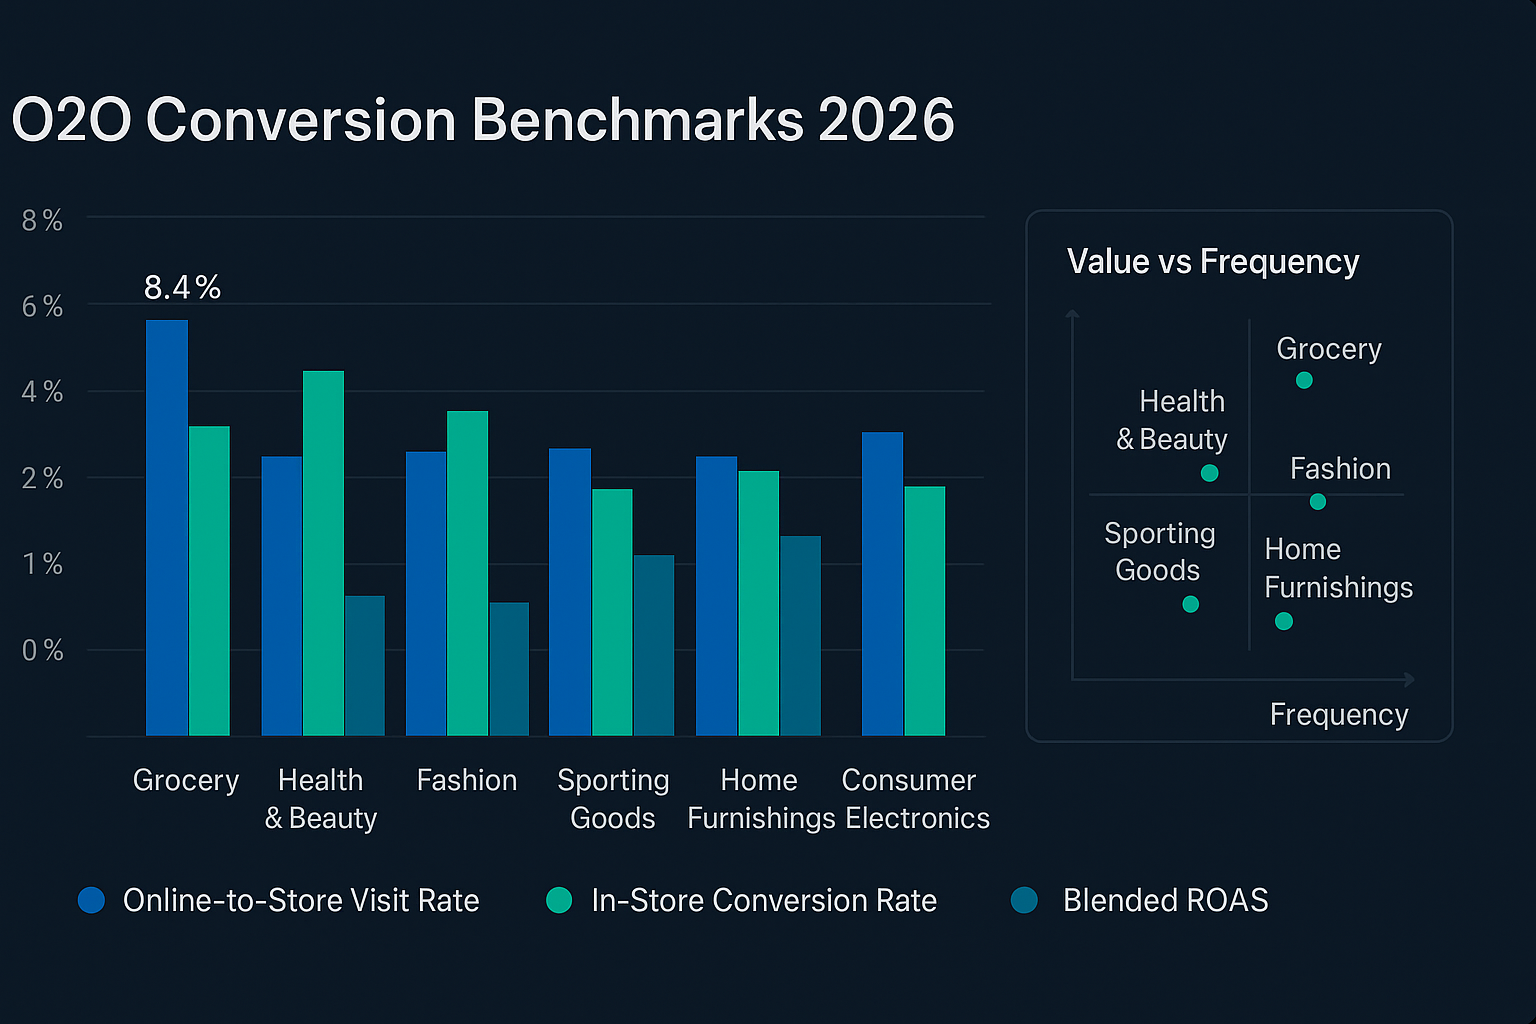
Aggregated conversion rate data across grocery, apparel, home goods, and QSR sectors, with methodology notes for each data source.
Built for practitioners
No demo calls, no sign-ups. Input your numbers and get a usable answer.
Local Conversion Calculator
Estimate the offline revenue attributable to your digital campaigns based on your traffic volume, AOV, and measured store visit rates.
Open CalculatorOmnichannel Audit Tool
Score your current measurement setup across five dimensions: data infrastructure, CX continuity, tech integration, content, and local optimization.
Run AuditAttribution Framework Generator
Select your channel mix, conversion goal and data volume. Get a recommended attribution model with implementation notes specific to your setup.
Generate FrameworkO2O conversion rates by sector
Median values from published research and platform data. Use as directional targets, not guarantees — results vary significantly by geography, campaign type, and store format.
| Retail Sector | Online-to-Store Visit Rate | In-Store Conversion Rate | O2O Blended ROAS | Primary Channel |
|---|---|---|---|---|
| Grocery & Supermarket | 6.2% | 68% | 4.1× | Local search + Maps |
| Apparel & Fashion | 3.8% | 42% | 3.3× | Paid social + retargeting |
| Home Goods & Furniture | 2.9% | 55% | 5.8× | Branded search + YouTube |
| QSR & Food Service | 8.4% | 71% | 3.9× | Local search + GBP |
| Consumer Electronics | 4.1% | 38% | 4.6× | Shopping ads + local inventory |
| Health & Beauty | 5.3% | 49% | 3.7× | Paid social + local search |
Sources: Google Retail Benchmarks 2024, Comscore State of Retail Media 2024, Forrester Research. Medians; 25th–75th percentile ranges available in the full benchmark report.
Measurement insights, delivered fortnightly
Analysis of omnichannel measurement research, platform changes affecting retail attribution, and practical frameworks — written for practitioners, not agencies pitching services.